The following are my notes from the ISLR book, available freely online here. I used Notion to present these notes in a Q+A format, done through toggles. The Notion page is here. The Jupyter Notebook of the lab and exercises can be found here.
2.1 - What is Statistical Learning?
- What is the general relationship between the quantitative response Y and p different predictors X1, X2, …, Xp? What do the different parts mean?
- Letting X = (X1, X2, …, Xp), we have a very general form
$$Y = f(X) + \epsilon$$- f is some fixed but unknown function of X1, …, Xp.
- represents the systematic information that X provides about Y
- e is some random error term, which is independent of X and has mean 0.
- What are the two main problems statistical learning solves?
- Prediction
- Problem Setup
- set of inputs X is available but output Y cannot be easily obtained - so we estimate it.
$\hat{Y} = \hat{f}(X)$- the error term averages to 0
- f hat is a black box
- Example:
- we have patient blood sample and we want to find the patient’s risk to a reaction for a drug. Don’t care how we get it, just that it’s accurate.
- Goal:
- reducible error = error which can be reduced by improving our model should be 0
- irreducible error = variability associated with e
- no matter how well we estimate f we cannot reduce the error from e.
$E(Y- \hat{Y})^2 = E[f(X)-\hat{f}(X)]^2+ Var(\epsilon)$- The first term is reducible, second term provides an upper bound for our prediction of Y (usually unknown in practice).
- Problem Setup
- Inference
- Problem Setup
- Understand the way Y is affected by changes in X1, …, Xp - estimate f to help us do this.
- f cannot be treated as a black box.
- Some common questions about data that are inference problems
- Which predictors are associated with the response?
- What is the relationship between the response and each predictor?
- Can the relationship between Y and each predictory be summarized linearly? Or need something more complicated?
- Problem Setup
Depending on the goal is prediction, inference or a combo dictates our methods for estimating f.
- Prediction
- Parametric vs non-parametric models?
- Parametric Models:
- reduces the problem down to estimates a set of parameters instead of the whole function space.
- two step model-based approach
- Make an assumption about the functional form of f. (eg. assume it’s linear, so f(X) = b0 + b1X1 +… + bpXp. )
- Fit or train the model by using the data we have to estimate the parameters (in this case the p+1 parameters)
- Non-parametric Models
- makes no assumptions about the shape of underlying data
- requires a lot more training data
- prone to overfitting - must pick levels of smoothness carefully.
- Parametric Models:
- What is the tradeoff between prediction accuracy and model interpretability?
- approaches that are very flexible tend to lead to such complicated estimates of f that it’s hard to tell the relationship between any individual predictor and the response.
- if inference is the goal, there are advantages to using simple non-flexible models
- sometimes, the non-flexible models might give better predictions too during to overfitting!
2.2 - Assessing Model Accuracy
- How do we measure quality of fit for regression problems?
-
Mean Squared Error (MSE)
$$MSE = \frac{1}{n}\sum_{i=1}^n(y_i-\hat{f}(x_i))^2$$ - What is the difference between Training MSE and Test MSE?
- training MSE is the error of the training model on the data that’s used to fit it. Most fitting methods try to reduce training MSE, but this is not a good indication of whether the model is actually good or not.
- test MSE is what you really want to decrease - it is the error of the model on data that it has not previously trained on.
- Most of the time, training MSE will be lower than test MSE.
- What is the relationship between model flexibility (degrees of freedom), training MSE, and test MSE?
- As the model gets more flexible, the training MSE decreases monotonically as it starts to fit the training data better.
- As the model gets more flexible, the test MSE typically follows a U-shape curve.
- When there is no flexibility, the model is unable to fit anything more than a line or something simple, so there is high predictive error.
- As we approach the “correct” flexibility levels, the test MSE aproaches Var(e), which is the lower bound.
- If the model is too flexible, it starts overfitting to the training data and the test MSE increases again.
- Overfitting refers to the phenomenon that a less flexible model can have a lower MSE.
-
- What is the Bias-Variance tradeoff?
- When analyzing the Expected test MSE (over all possible training sets), we see the U curve as flexibility of the model increases. This is because test MSE breaks down into 3 parts:
$Var(\hat{f}) = E [(\hat{f} - E(\hat{f}))^2]$- measures how varied the prediction is if one point in the training data was changed.
- Var(f hat) is high for models with high flexibility because changing one training data point will affect the output substantially (think overfitting)
$Bias(\hat{f})^2 = E[\hat{f} - f]^2$- measures the error from approximating the real-life problem down to a simplified model.
- simple models (eg linear) have high bias because oftentimes you are simplifying the problem too much.
- as you increase model flexibility, bias decreases because you make less assumptions.
- Var(e)
- irreducible error.
$E[(f-\hat{f})^2] = Var(\hat{f}) + [Bias(\hat{f})]^2 + Var(\epsilon)$- prove this with
$y = f + \epsilon$ - then add and subtract
$E(\hat{f})$insite the square. - note that Var(e) = E(e^2) because E(e) = 0
- When analyzing the Expected test MSE (over all possible training sets), we see the U curve as flexibility of the model increases. This is because test MSE breaks down into 3 parts:
- What is the goal when trying to find a model in terms of bias and variance?
- You should try to find a method for which both bias and variance are low.
- You can get low variance (but high bias) with linear models
- You can get low bias (but high variance) with complex non-linear models that fit through all training data.
- How do we measure model accuracy in a classification problem?
- Error Rate
- proportion of mislabeled observations
- goal of algorithm is to minimize training error rate:
$\frac{1}{n}\sum_{i=1}^{n}I(y_i \neq \hat{y}_i)$ - test error rate is
$Ave(I(y_0 \neq \hat{y}_0))$ - A good classifier is one for which the test error is smallest.
- Error Rate
- What is a Bayes Classifier and why do we care about it?
- How does it assign labels?
- Assigns each observation to the most likely class, given its predictor values.
- Give label j to observation x0 for which
$P(Y=j|X=x_0)$is largest
- What special property does the Bayes Classifier have?
- minimizes the test error rate
- What is the overall Bayes error rate? What is it analogous to in the regression case?
- Since the Bayes classifier will always choose the class for which the conditional probability is largest, the error rate (probability of misclassification) at X = x0 will be
$1-\max_j P(Y=j|X=x_0)$ - In expectancy, the overall Bayes error rate is given by:
$1-E(\max_j P(Y=j|X))$, where the expectation is over all possible values of X. - Bayes error rate is analogous to the irreducible error
$\epsilon$
- Since the Bayes classifier will always choose the class for which the conditional probability is largest, the error rate (probability of misclassification) at X = x0 will be
- How does it assign labels?
- Why can’t we use the Bayes Classifier in all settings?
- we would need to know the conditional distribution of Y given X, and so computing the Bayes classifier is impossible.
- therefore, the Bayes classifier is an unattainable gold standard.
- What values of KNN affect flexibility?
- As K goes higher, the classifier has less flexibility = less variance, more bias.
- As 1/K goes higher, we see the U curve of testing error rate.
2.4 - Exercises
- Inflexible or flexible method?
- sample size n is large, number of predictors p is small - flexible method will be better because we have a lot of training data.
- p is extremely large, n is small - inflexible method is better because we do not want high variance in the model from the small number of data points
- relationship is highly non-linear - flexible methods will reduce bias and give an accurate model, but we must also have a lot of training samples to reduce variance.
- variance of error terms is extremely high - inflexible methods are better because they have low variance and do not change too much from fluctuations in a training data point that might be caused due to the error.
- Classification or Regression? Inference or prediction? n and p?
- collect data on top 500 firms - profit, employees, industry and CEO salary. Trying to understand which factors affect CEO salary?
- Regression problem - CEO salary is a quantitative output variable
- Inference - trying to understand how the different predictors affect output
- n = 500
- p = 3 (CEO Salary is output variable and not a predictor)
- new product either success or failure. collect data on 20 products - success or fail, price, marketing budget, competition price, and ten other variables
- Classification problem - trying to classify the new product
- Prediction problem - based on previous data, predict whether new product will succeed
- n = 20
- p = 13
- predicting the % change in US dollar in relation to weekyl changes in world stock markets. Collect weekly data for all of 2012 - % change in dollar, % change US market, % change in British market, % change German market
- Regression problem
- Combination of prediction and inference - want to figure out the result as well as what causes it
- n = 52 weeks
- p = 3 (% change in dollar is the output variable)
- collect data on top 500 firms - profit, employees, industry and CEO salary. Trying to understand which factors affect CEO salary?
- bias-variance decomposition
-
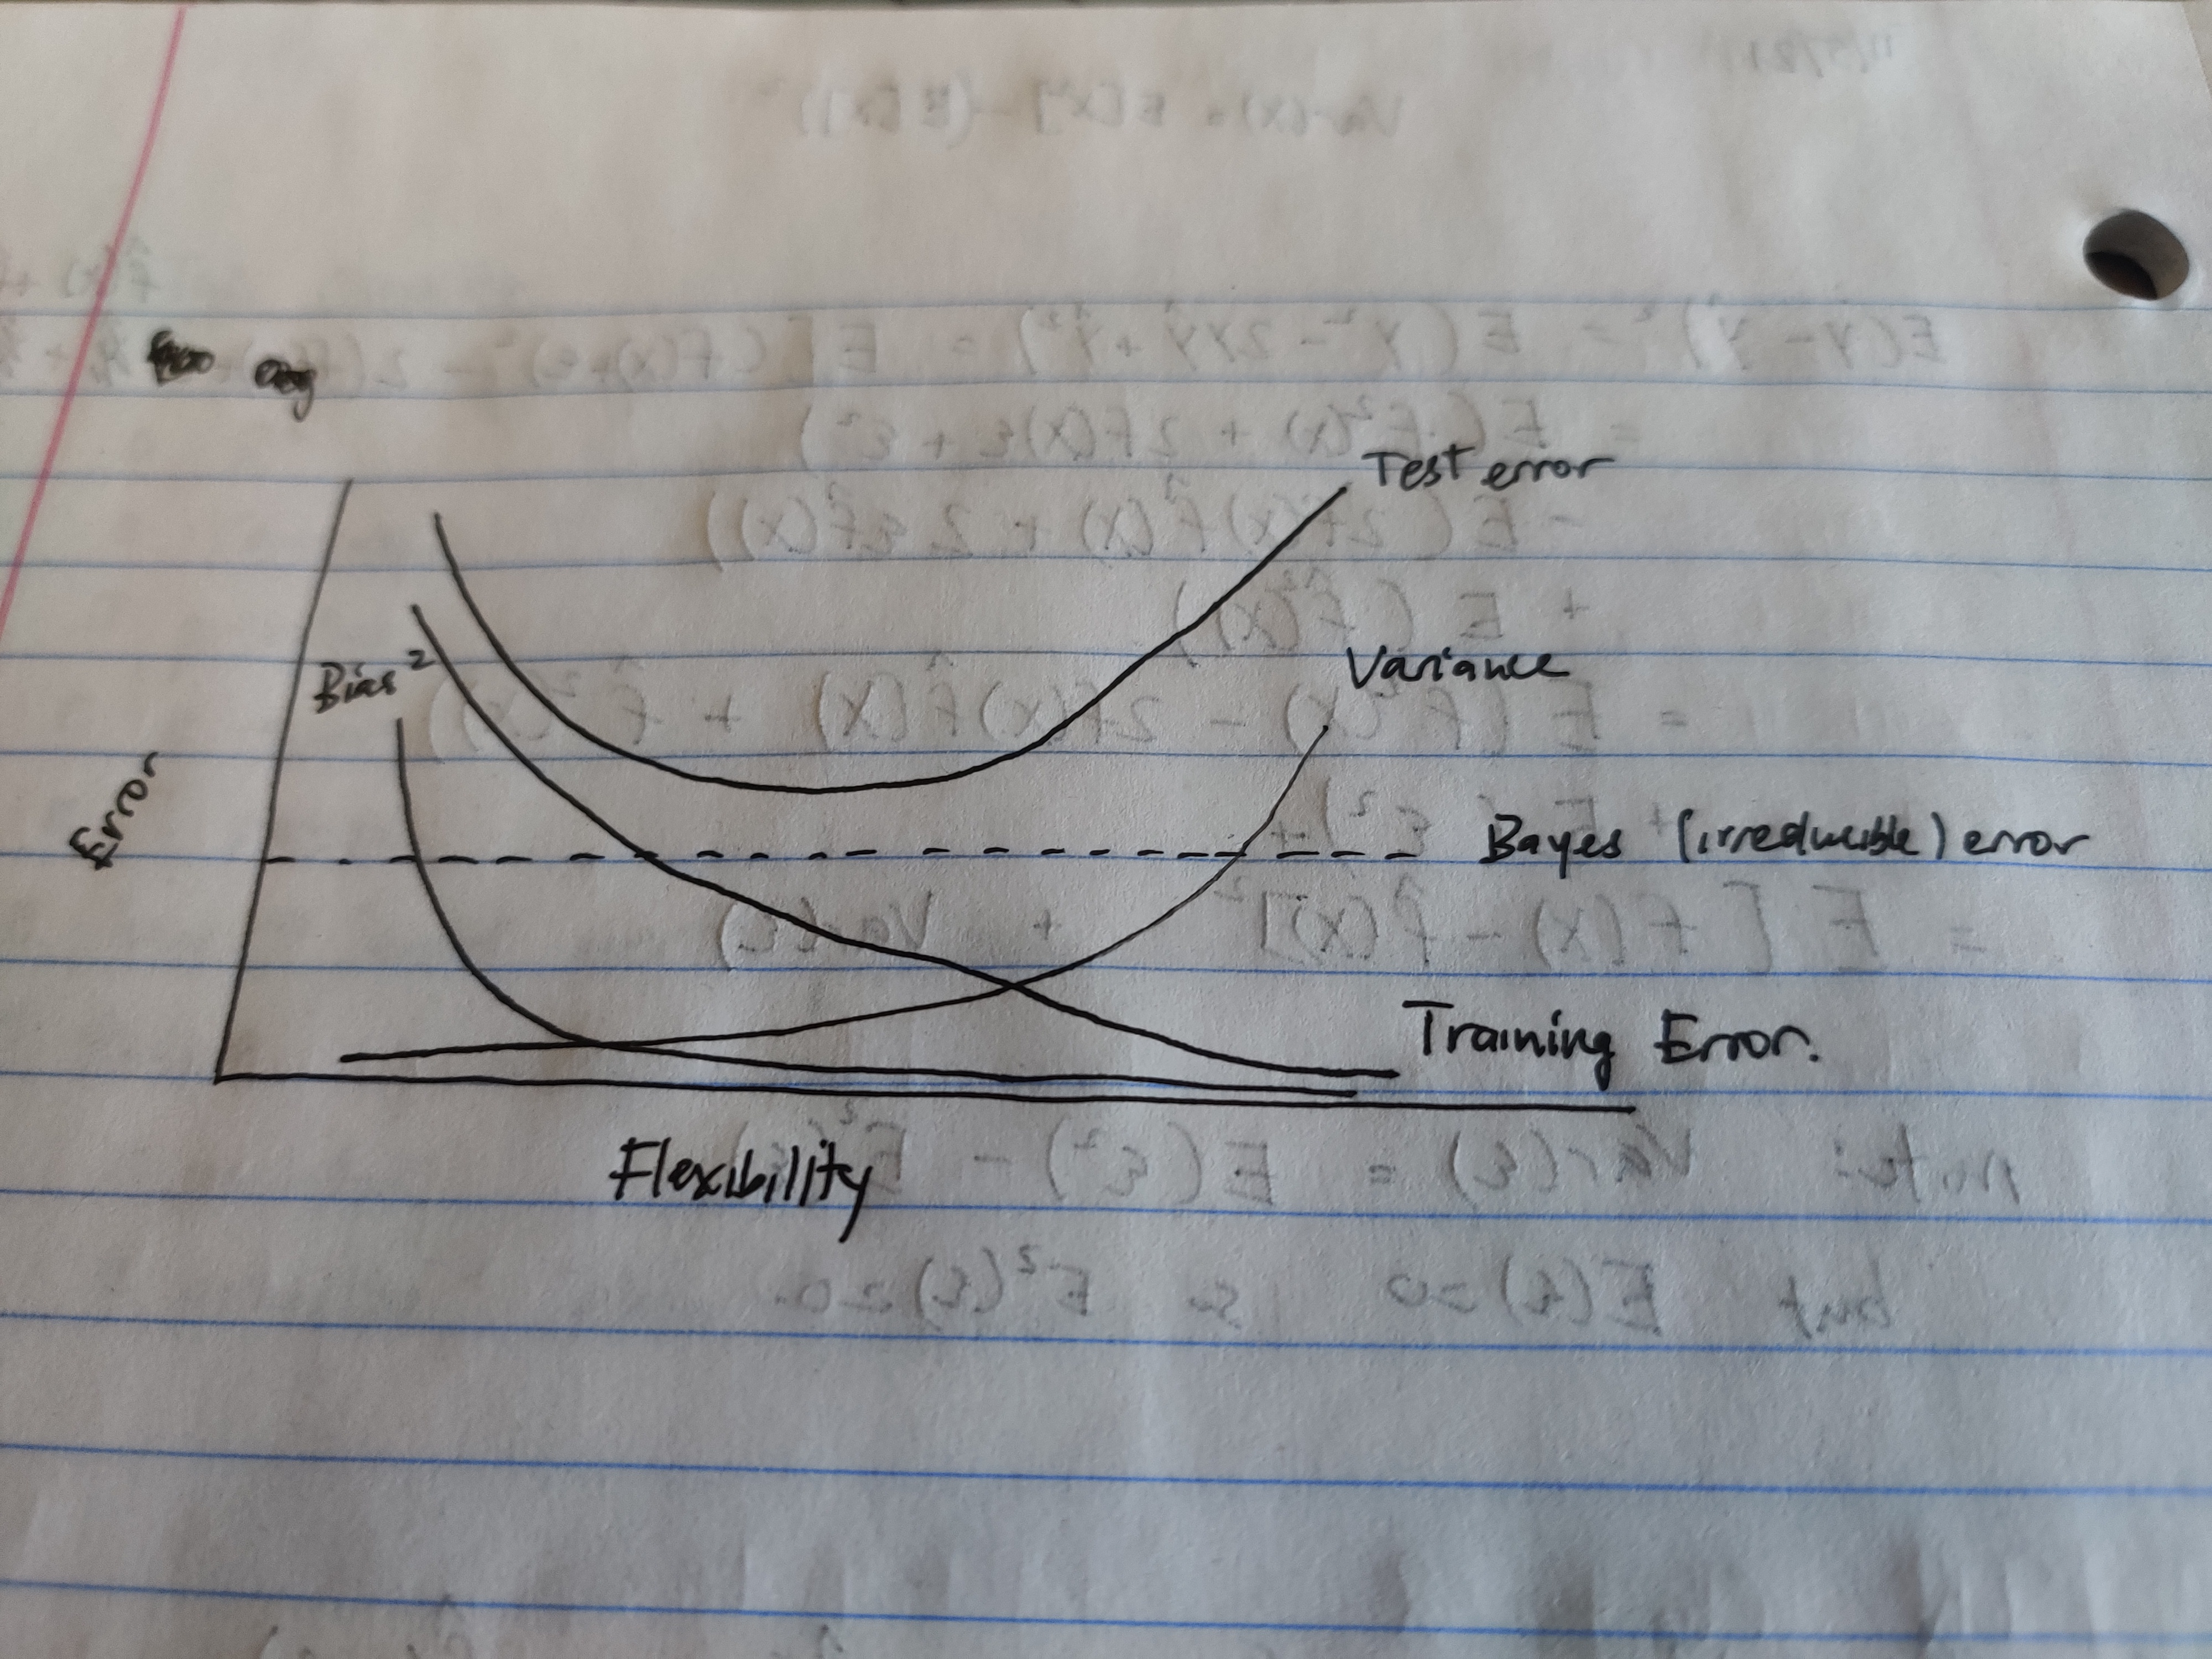
draw out curves of Bias^2, Variance, Irreducible error, Training error, Testing error
-
explain
- Bias^2 decreases as model flexbility increases, because a more flexible model does not lose accuracy when estimating the real world with a model
- Variance increases as model flexibility increases because a more flexible model can produce different results on different training sets
- Irreducible error (Bayes error rate) is just a horizontal line that denotes the lower bound on the test error
- Test error = Bias^2 + Variance + Irreducible error
- Training error approaches 0 as the model gets more flexible and overfits to the training data.
-
- real-life examples
- classification - cancer or not based on blood test results, product is a success or failure based on other similar products, type of bread based on picture; email spam or not spam
- regression - home prices based on location, etc.; how much weight somebody can lift based on height, weight; number of people at a concern based on prior concert tickets and location
- cluster analysis - genre based on movie sales data, fashion trends based on price and stuff,
-
advantages and disadvantages of flexible approach to regression and classification?
advantages to flexibility
- able to predict complex functions (non-linear)
- low bias
disadvantages to flexibility
- requires a lot of training data
- high variance to input dataset
- caution of overfitting
less flexible dataset might be better if data is straightforwardly modeled (close to linear), or if there are not that many observations in the training data, or if the variance of the error term is high.
-
parametric statistical learning function reduces learning a function down to fitting several parameters. two step process - make assumption about the dataset, and then estimate those parameters
non-parametric learning function does not make any assumptions about underlying function, but runs into overfitting problems, and requires a lot of training data and care to smoothness parameter.
- KNN example
-
distances from X1= X2=X3=0
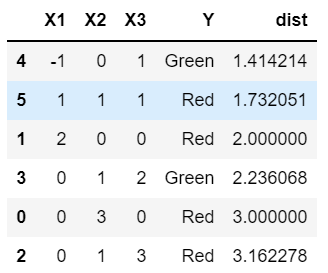
- with K = 1, we predict Green
- with K = 3, we predict Red
- if the decision boundary is highly non-linear, we want a flexible model to be able to model it accurately. So we will want to pick a small K.
-